Viewing session data
Click onSessions in the left-hand navigation bar to see a table of all recorded sessions. By default, this table lists:
- Session ID – The unique identifier automatically generated by Roundtable Proof-of-Human
- User ID – The user identifier you provided (if any)
- Risk Score – The numerical risk score (0-100) generated by Roundtable Proof-of-Human
- Risk Explanation – A brief description of why the risk score was assigned to the session
- Session Duration – How long the session lasted
- City – The user’s city (inferred from their IP address)
- Country – The user’s country (inferred from their IP address)
- Status – Live or Complete, depending on whether there was any user activity within the last 30 minutes
- Agent behavior – An ML model detected patterns across biometric data consistent with automated behavior. The ML model only runs on Desktop sessions (Windows, macOS, Linux).
- Programmatic typing – The user enters text in an extremely consistent way, consistent with programmatic entry
- Teleporting mouse – The user’s cursor jumps large distances with no intermediate movement
- No corrections – A large amount of text is entered without any backspaces or correction events
- All pasted – All text is pasted or entered all-at-once
- Jump scrolling – The user scrolls in large jumps with no intermediate or continuous scroll events
- Centered clicks – User made perfectly centered clicks with no natural variation
- Programmatic clicking – User clicks were made programmatically rather than through natural user interaction
- External input – User left the survey tab and pasted input after returning
- Bot – The browser fingerprint matches known automation frameworks such as Selenium and Playwright
- Virtual machine – Signals suggest the browser is running in a remote, virtualized, sandboxed, or software-rendered environment
- Software renderer – The browser is using a software-based graphics renderer (e.g. SwiftShader or llvmpipe) instead of hardware acceleration, which may suggest a remote, virtualized, or headless browser environment
- VPN – The user’s IP address belongs to a commercial VPN or hosting provider
- TOR – The user’s connection is routed through a Tor exit node
- Location spoofing – The user’s browser-reported GPS coordinates conflict with the IP-inferred location
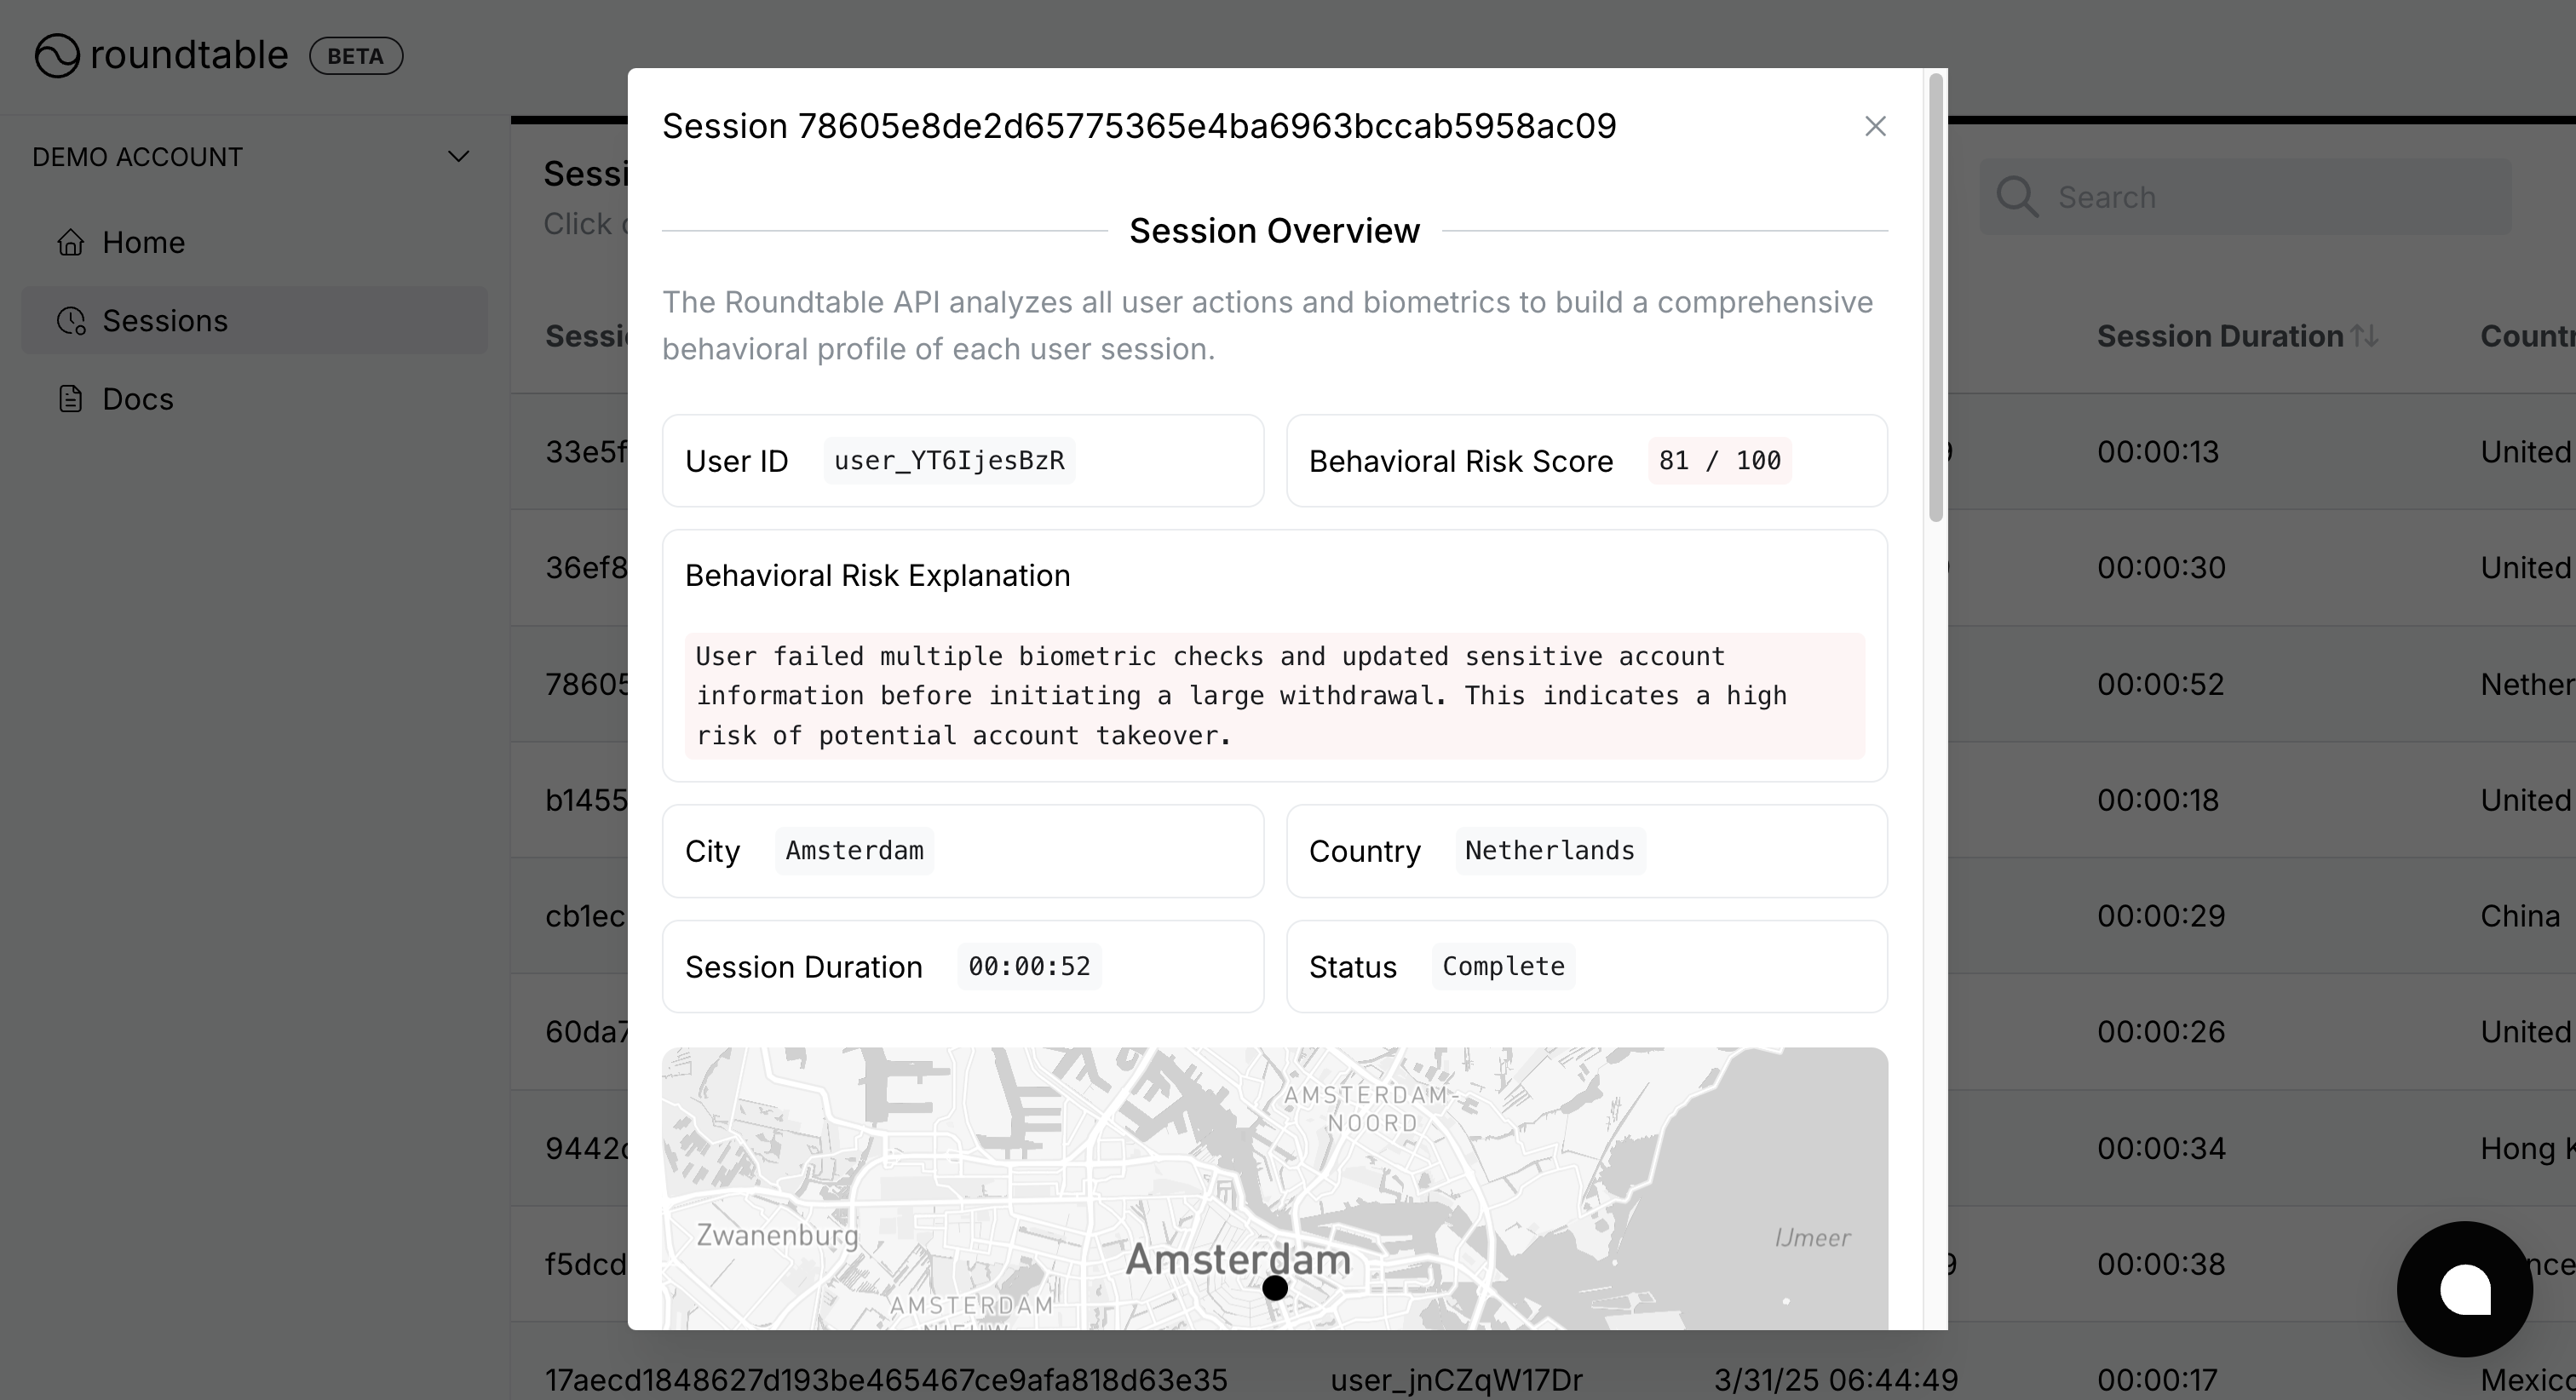
Viewing session details
Click on any session row to open a Session Overview modal. Here, you can view the risk scores, risk explanation, complete user action log, and biometric and device checks.